

Beyond Kill Chains: A Graph-Theoretic Framework for Attack Modeling
This article proposes a graph-theoretic framework where attack tactics form nodes in a directed graph with weighted edges representing transition probabilities and dependencies.

Levente Simon
Beyond Kill Chains: A Graph-Theoretic Framework for Attack Modeling
From Sequential Chains to Dynamic State Machines
Abstract
Traditional cybersecurity models conceptualize attacks as linear "kill chains" progressing through sequential phases. This article proposes a graph-theoretic framework where attack tactics form nodes in a directed graph with weighted edges representing transition probabilities and dependencies. We argue that attacks are better modeled as state machines with cycles, branches, and context-dependent transitions. This framework enables data-driven resource allocation and domain-specific security strategy optimization.
Research Motivation
Limitations of Linear Models
Current security frameworks suffer from sequential thinking:
- Lockheed Martin Kill Chain: Assumes linear progression through reconnaissance → weaponization → delivery → exploitation → installation → command & control → actions
- MITRE ATT&CK: Provides tactics and techniques but lacks formal relationship modeling
- NIST Framework: Focuses on functional areas rather than attack dynamics
Core Problem: Real attacks are iterative, adaptive, and highly context-dependent. Linear models miss critical relationships and fail to prioritize defensive investments effectively.
Graph Theory Advantages
Modeling attacks as directed graphs enables:
- Cycle detection: Lateral movement loops, persistence re-establishment
- Critical path analysis: Identifying high-impact disruption points
- Probabilistic reasoning: Weighting transitions based on empirical data
- Context adaptation: Different edge weights for different environments
Theoretical Framework
Illustrative Example: Hypothetical Attack Graph
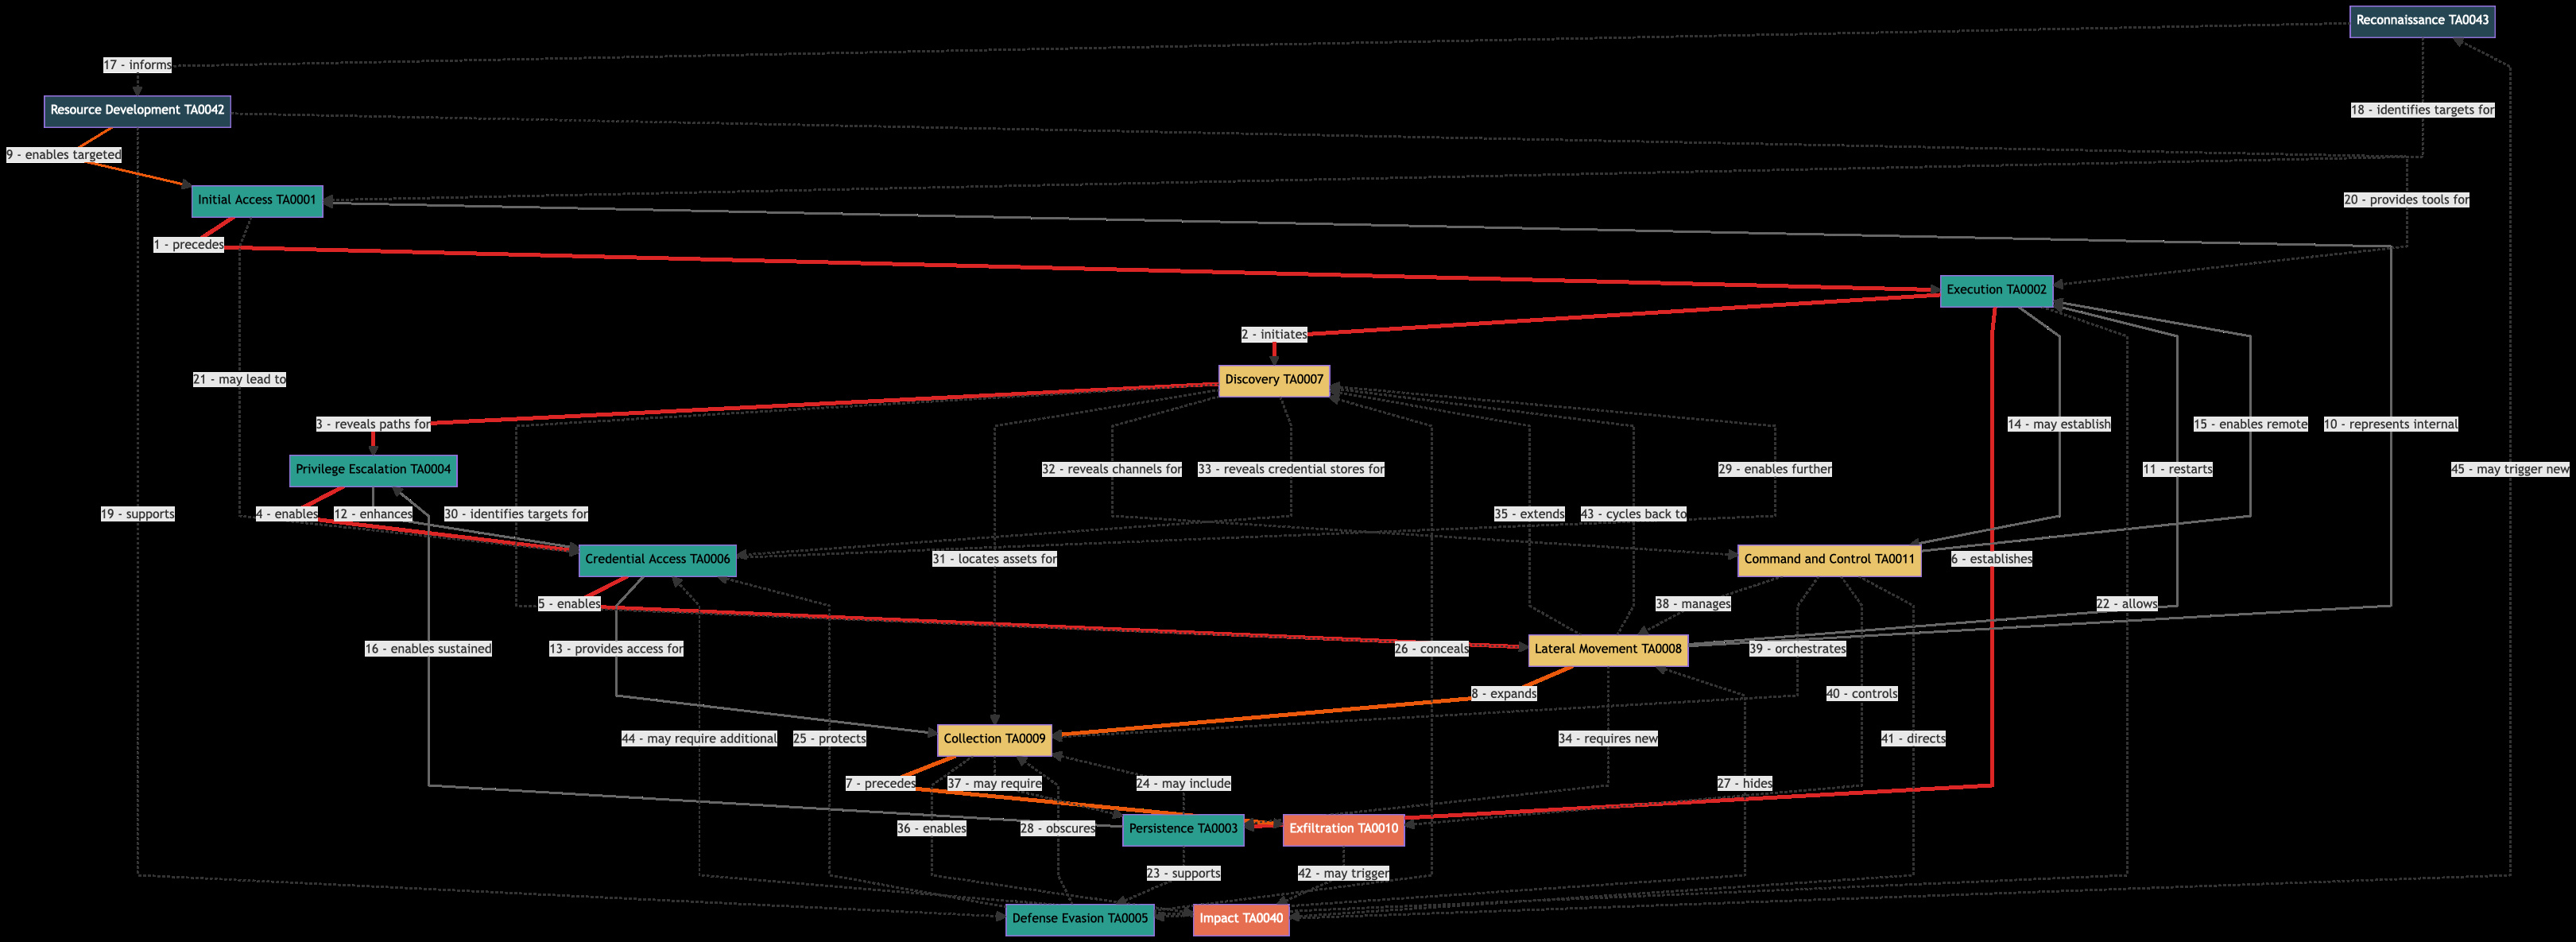
The following diagram illustrates the proposed graph-theoretic approach using MITRE ATT&CK tactics. This is a conceptual example only - the specific relationships and priorities shown require empirical validation and may vary significantly across environments.
Visual Legend
- 🔴 Red thick lines: Attack-Breaking Critical Path (relationships 1-6)
- 🟠 Orange thick lines: Damage Limitation Critical Path (relationships 7-8 )
- 🟠 Orange normal lines: Advanced Threat Enablers (relationship 9)
- ⚫ Gray normal lines: Supporting Flow Relationships (relationships 10-16)
- ⚫ Gray dashed lines: Supporting/Information Relationships (relationships 17-45)
Relationships Documentation
🔴 Attack-Breaking Critical Path (1-6)Red thick lines representing early disruption opportunities - stopping these breaks the attack
- Initial Access → Execution
Relationship: Initial Access precedes Execution
Explanation: Once attackers gain entry, their immediate priority is achieving code execution. This is the critical transition from "foothold" to "active compromise."
Defensive Focus: Application allowlisting, EDR behavioral monitoring, process creation monitoring - Execution → Discovery
Relationship: Execution initiates Discovery
Explanation: Modern attacks depend heavily on discovery for effectiveness. Blind attacks rarely succeed in complex enterprise environments. Discovery immediately follows execution to map the environment.
Defensive Focus: Network scanning detection, AD enumeration monitoring, reconnaissance detection systems - Discovery → Privilege Escalation
Relationship: Discovery reveals paths for Privilege Escalation
Explanation: Discovery activities identify privilege escalation opportunities, vulnerable services, and misconfigured systems. This intelligence directly informs escalation attempts.
Defensive Focus: Privilege enumeration detection, vulnerability scanning alerts, system hardening - Privilege Escalation → Credential Access
Relationship: Privilege Escalation enables Credential Access
Explanation: Elevated privileges are typically required for effective credential harvesting (LSASS dumps, registry access, memory scraping). System/admin rights unlock credential stores.
Defensive Focus: LSASS protection, credential access monitoring, privileged access management - Credential Access → Lateral Movement
Relationship: Credential Access enables Lateral Movement
Explanation: Valid credentials are the primary method for lateral movement in enterprise environments, allowing attackers to authenticate to remote systems legitimately.
Defensive Focus: Authentication monitoring, network segmentation, just-in-time access controls - Execution → Persistence
Relationship: Execution establishes Persistence
Explanation: After gaining code execution, attackers typically establish persistence mechanisms to maintain access across reboots, credential changes, or detection attempts.
Defensive Focus: System integrity monitoring, persistence mechanism detection, configuration baselines
🟡 Damage Limitation Critical Path ( 7-8 )Orange thick lines representing late-stage defense - focus when early disruption fails
- Collection → Exfiltration
Relationship: Collection precedes Exfiltration
Explanation: Data must be identified, gathered, and staged before it can be stolen. This represents the direct progression from data gathering to data theft.
Defensive Focus: DLP systems, egress filtering, data staging detection - Lateral Movement → Collection
Relationship: Lateral Movement expands Collection opportunities
Explanation: Each successful lateral movement provides access to new data repositories and expands the attacker's collection capabilities across the network.
Defensive Focus: Cross-system data access monitoring, network segmentation for data protection
🔵 Advanced Threat Enablers (9)Orange normal lines for sophisticated/targeted attacks
- Resource Development → Initial Access (Targeted)
Relationship: Resource Development enables targeted Initial Access
Explanation: Critical for targeted attacks with custom malware and infrastructure, but irrelevant for most opportunistic attacks using existing tools and techniques.
Defensive Focus: Threat intelligence, infrastructure analysis, custom signature development
⚫ Supporting Flow Relationships (10-16)Gray normal lines representing important operational capabilities
- Lateral Movement → Initial Access (Internal)
Relationship: Lateral Movement represents internal Initial Access
Explanation: Each lateral movement to a new system essentially restarts the attack cycle internally, requiring new initial access within the compromised environment. - Lateral Movement → Execution
Relationship: Lateral Movement restarts Execution
Explanation: After moving laterally to a new system, attackers must establish execution capabilities on that system to continue operations. - Privilege Escalation → Credential Access (Enhanced)
Relationship: Privilege Escalation enhances Credential Access
Explanation: Beyond the primary flow, elevated privileges also enhance the scope and effectiveness of credential harvesting operations. - Credential Access → Collection
Relationship: Credential Access provides access for Collection
Explanation: Valid credentials unlock access to file shares, databases, email systems, and other repositories where valuable data can be collected. - Execution → Command and Control
Relationship: Execution may establish Command and Control
Explanation: Code execution capabilities are often used to establish C2 channels, download additional tools, or communicate with attacker infrastructure. - Command and Control → Execution
Relationship: Command and Control enables remote Execution
Explanation: Established C2 channels allow attackers to remotely execute commands, scripts, and additional payloads throughout the compromised environment. - Persistence → Privilege Escalation
Relationship: Persistence enables sustained Privilege Escalation
Explanation: Persistent access mechanisms often include privilege escalation components or provide sustained access needed for privilege escalation attempts over time.
⚫ Supporting/Information Relationships (17-42)Gray dashed lines representing information, protection, and facilitation
17-33 - Information and Intelligence Relationships
- Reconnaissance → Resource Development**: Intelligence informs tool/infrastructure development
- Reconnaissance → Initial Access**: Identifies specific targets for compromise
- Resource Development → Defense Evasion**: Custom tools designed for evasion
- Resource Development → Execution**: Provides execution tools and payloads
- Initial Access → Credential Access**: Some vectors provide direct credential access
- Execution → Defense Evasion**: Enables evasion techniques (process hollowing, etc.)
- Persistence → Defense Evasion**: Persistence designed with evasion in mind
- Persistence → Collection**: Some persistence includes collection capabilities
- Defense Evasion → Credential Access**: Protects credential harvesting from detection
- Defense Evasion → Discovery**: Conceals discovery activities
- Defense Evasion → Lateral Movement**: Hides lateral movement from monitoring
- Defense Evasion → Collection**: Obscures data collection activities
- Credential Access → Discovery**: Valid credentials enable further discovery
- Discovery → Lateral Movement**: Identifies lateral movement targets
- Discovery → Collection**: Locates data repositories for collection
- Discovery → Command and Control**: Reveals communication channels
- Discovery → Credential Access**: Identifies credential stores and vaults
34-42 - Operational and Command Relationships
- Lateral Movement → Persistence**: New systems require new persistence
- Lateral Movement → Discovery**: New systems provide new discovery vantage points
- Collection → Impact**: Collected data enables impact operations
- Collection → Persistence**: Large-scale collection requires persistent access
- Command and Control → Lateral Movement**: C2 coordinates lateral movement
- Command and Control → Collection**: C2 orchestrates collection activities
- Command and Control → Exfiltration**: C2 manages data exfiltration
- Command and Control → Impact**: C2 directs impact operations
- Exfiltration → Impact**: Data theft followed by additional impact
🔄 Cyclic Relationships (43-45)Gray dotted lines representing feedback loops and attack cycle restarts
- Lateral Movement → Discovery (Cycle)
Relationship: Lateral Movement cycles back to Discovery
Explanation: Each successful lateral movement opens new discovery opportunities, creating a continuous cycle of movement and exploration. - Impact → Credential Access (Cycle)
Relationship: Impact may require additional Credential Access
Explanation: Certain impact operations (like domain-wide ransomware) may require additional high-privilege credentials to achieve maximum effect. - Impact → Reconnaissance (Cycle)
Relationship: Impact may trigger new Reconnaissance
Explanation: After successful impact, attackers may conduct new reconnaissance to identify additional targets for follow-up operations or to assess the effectiveness of their actions.
Critical Disclaimers:
- Edge weights and relationship types are hypothetical examples requiring validation
- Real attack graphs will vary significantly by environment, threat actor, and context
- The "high-probability transitions" shown are research hypotheses, not proven relationships
- This diagram illustrates the modeling approach, not validated attack patterns
State Machine Representation
Each attack can be modeled as a finite state automaton:
States (S): {Initial_Access, Execution, Persistence, Privilege_Escalation, ...}
Alphabet (Σ): {Environmental_Context, Actor_Type, Target_Value, ...}
Transition Function (δ): S × Σ → P(S) [probabilistic transitions]
Start State (s₀): Initial_Access
Accept States (F): {Impact, Exfiltration}
Key Insight: The same attack tactic can have different transition probabilities based on context variables (environment, threat actor, target value).
Edge Classification Hypothesis
We propose classifying edges into categories based on their role in attack success:
- Critical Dependencies: Target cannot be achieved without source (hard dependencies)
- Enhancement Relationships: Source improves probability/effectiveness of target
- Information Flows: Source provides intelligence that informs target selection
- Cyclic Transitions: Tactics that restart or repeat attack phases
Research Question: Can we empirically validate these classifications through incident analysis?
Mathematical Formulation
For a given environment context C, the attack graph G(C) = (V, E, W) where:
- V = set of MITRE ATT&CK tactics
- E = directed edges representing possible transitions
- W: E → 0,1 = weight function representing transition probabilities
Attack Path Probability: For path p = v₁, v₂, ..., vₙ, P(p|C) = ∏ᵢ w(vᵢ, vᵢ₊₁|C)
Critical Path Definition: Path p* such that removing any edge reduces overall attack success probability by >threshold τ
Domain-Specific Adaptations
Cloud Environments
Hypothesis: Cloud attacks exhibit different graph structures than on-premises networks.
Proposed State Modifications:
- Initial_Access → {Credential_Compromise, Service_Exploitation, Misconfiguration}
- Lateral_Movement → {Cross_Service_Access, Role_Escalation, Account_Switching}
- Persistence → {Backdoor_Users, Policy_Modification, Resource_Hijacking}
Research Questions:
- Do cloud environments show higher transition probabilities between certain tactics?
- Are there cloud-specific cycles not present in traditional networks?
Industrial Control Systems (ICS/SCADA)
Hypothesis: OT environments exhibit fundamentally different attack graph structures due to air gaps and legacy systems.
Proposed Adaptations:
- Bifurcated graphs: IT_Network_Graph → OT_Network_Graph transitions
- Safety considerations: Impact states include {Process_Disruption, Physical_Damage, Safety_System_Compromise}
- Extended lateral movement cycles due to network architecture
Small/Medium Businesses
Hypothesis: SMB environments exhibit compressed attack graphs with higher transition probabilities between tactics.
Proposed Characteristics:
- Shorter critical paths due to reduced network complexity
- Higher edge weights for privilege escalation due to credential reuse
- Different accept states reflecting different attacker objectives
Practical Applications Framework
Resource Allocation Optimization
Problem Statement: Given limited security budget B, how should resources be allocated across defensive capabilities?
Proposed Method:
- Model current environment as attack graph G(C)
- Calculate critical paths and edge importance scores
- Map defensive controls to graph edges (control c reduces edge weight w by factor f)
- Solve optimization problem: maximize attack path disruption subject to budget constraint B
Mathematical Formulation:
maximize: Σ(path importance × disruption caused by controls)
subject to: Σ(control costs) ≤ B
Strategic Planning Applications
Threat Modeling: Generate attack graphs for planned system changes Red Team Optimization: Identify highest-probability attack paths for testing Vendor Selection: Evaluate security products based on graph edge coverage Compliance Mapping: Align regulatory requirements with critical graph paths
Empirical Validation Framework
Data Requirements
- Historical incident reports with tactical progression sequences
- Environmental context variables (network architecture, security controls)
- Threat actor attribution and capability assessments
- Time-series data on attack technique prevalence
Proposed Experiments
Experiment 1: Graph Structure Validation
Hypothesis: Attack progression data will show non-random patterns consistent with graph structure Method: Statistical analysis of tactic transition frequencies in incident databases Success Criteria: Significant deviation from random transitions, identifiable patterns
Experiment 2: Critical Path Identification
Hypothesis: Certain tactical transitions are more critical for attack success than others Method: Comparative analysis of successful vs. failed attacks, identifying common disruption points Success Criteria: Statistically significant differences in critical path components
Experiment 3: Context Dependency
Hypothesis: Environmental context significantly affects transition probabilities Method: Multi-environment analysis of attack patterns (cloud vs. on-premises vs. hybrid) Success Criteria: Measurable differences in graph structure across environments
Experiment 4: Practical Validation
Hypothesis: Graph-informed resource allocation outperforms traditional approaches Method: Simulated attack scenarios with different defensive allocation strategies Success Criteria: Improved attack disruption rates with graph-optimized defenses
Implementation Methodology
Phase 1: Graph Construction
- Data Collection: Systematic analysis of published incident reports
- Context Classification: Environmental and threat actor categorization
- Transition Mapping: Statistical analysis of tactic-to-tactic progressions
- Validation: Expert review and red team validation of graph structures
Phase 2: Probabilistic Modeling
- Weight Calculation: Statistical estimation of transition probabilities
- Uncertainty Quantification: Confidence intervals for edge weights
- Context Adaptation: Environmental modifier calculations
- Temporal Analysis: How edge weights change over time
Phase 3: Optimization Framework
- Control Mapping: Defensive controls to graph edge relationships
- Cost Modeling: Resource requirements for different defensive strategies
- Optimization Algorithms: Multi-objective optimization for resource allocation
- Sensitivity Analysis: Robustness testing of optimization results
Critical Limitations and Research Challenges
Data Quality Issues
- Reporting Bias: Successful attacks may be under-reported
- Attribution Challenges: Uncertain threat actor identification affects context modeling
- Temporal Drift: Attack patterns evolve faster than data collection cycles
Model Validation Challenges
- Ground Truth: Difficult to validate probabilistic models without extensive historical data
- Environment Specificity: Models may not generalize across organizations
- Adversarial Adaptation: Attackers may adapt to known graph structures
Practical Implementation Barriers
- Complexity: Graph-based planning may be too complex for operational teams
- Data Requirements: Organizations may lack sufficient incident data for modeling
- Integration: Existing security tools may not support graph-based approaches
Open Research Questions
- Graph Topology: What are the fundamental structural properties of attack graphs across different domains?
- Temporal Dynamics: How do attack graphs evolve over time, and can we predict these changes?
- Multi-Actor Modeling: How do simultaneous attacks by different actors affect graph dynamics?
- Defensive Integration: What graph modifications result from specific defensive technologies?
- Measurement Frameworks: How do we empirically validate graph-based security improvements?
- Adversarial Robustness: How quickly do attackers adapt to graph-optimized defenses?
Conclusion
The graph-theoretic approach to attack modeling represents a paradigm shift from linear thinking to systems thinking in cybersecurity. By modeling attacks as state machines with probabilistic transitions, we can potentially optimize defensive strategies in ways that linear models cannot support.
However, significant empirical work is required to validate this framework. The core hypotheses about graph structure, critical paths, and context dependency need rigorous testing with real-world data.
This framework should be viewed as a research agenda rather than a proven methodology. Its value will ultimately depend on empirical validation and practical demonstration of improved security outcomes.
The transition from intuitive security planning to data-driven, graph-optimized strategies represents both an opportunity and a challenge for the cybersecurity community. Success will require collaboration between security practitioners, data scientists, and graph theorists.
Future Research Directions
- Development of standardized attack graph datasets for community research
- Investigation of machine learning approaches for automated graph construction
- Game-theoretic analysis of attacker-defender interactions on attack graphs
- Integration with existing security frameworks (NIST, ISO 27001) through graph mappings
- Economic analysis of graph-optimized security investments
This paper presents a theoretical framework requiring empirical validation. All optimization claims are hypothetical pending experimental verification.
More articles
The Tunnels Under Your Security Boundaries
Every organization has two architectures: the one that was designed, and the one that actually exists. Drawing lessons from the Củ Chi tunnel network, this article examines why list-based security fails against graph-traversing adversaries.
February 4, 2026
Add the Firewall Last
When firewalls are your foundation, everything inside becomes one giant implicit trust zone. Design secure architecture first—nodes that can defend themselves—then add firewalls for defense in depth, not structural dependency.
February 2, 2026