
Graph-native threat modeling platform
Security is a graph problem.
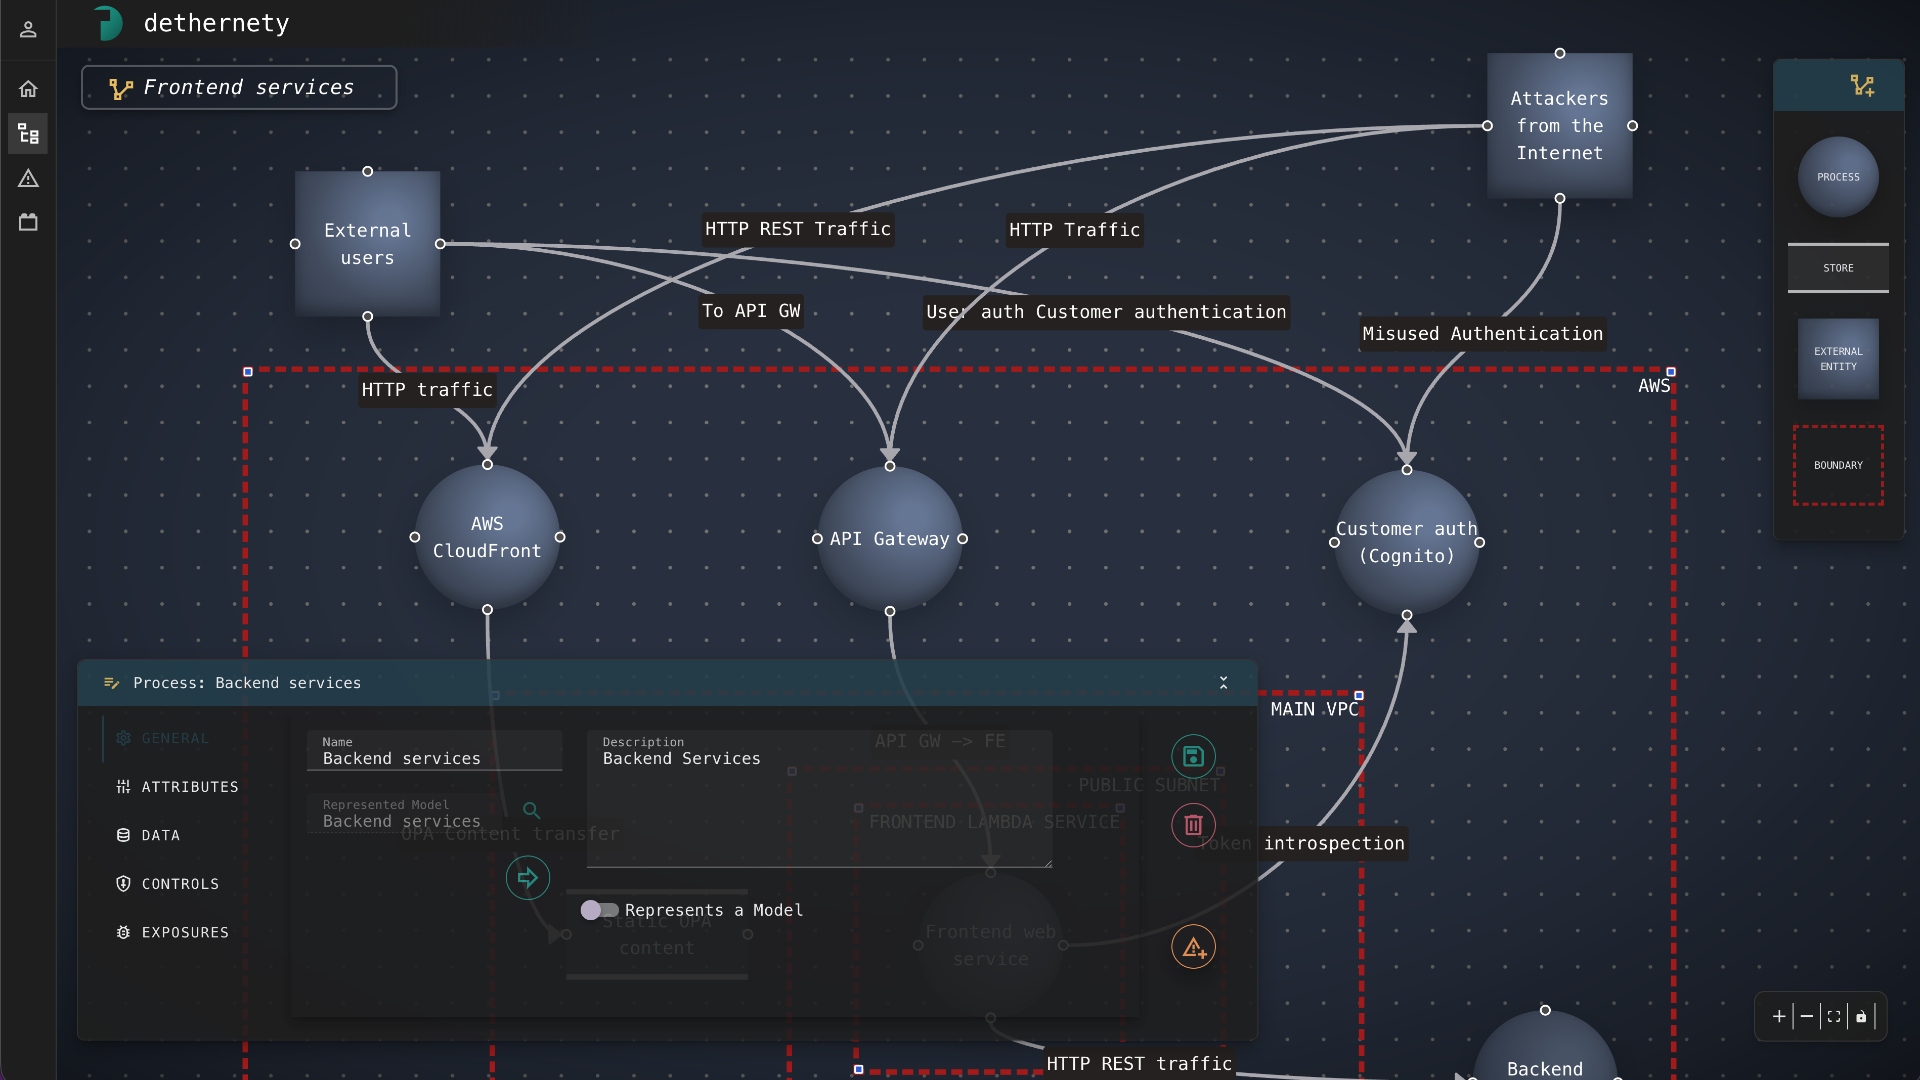
Model your architecture as a graph. Analyze attack paths, exposures, and controls with full architectural context.
Built to analyze, not just document

Graph-Native Analysis
Model security as relationships, not rows. Attack paths, blast radius, and chokepoints are first-class graph operations.
MITRE ATT&CK Integration
Automatic exposure-to-ATT&CK and control-to-D3FEND mapping. Coverage gap analysis in seconds.

Pluggable AI Analysis
From deterministic queries to multi-agent LangGraph workflows. Swappable analysis engines, zero vendor lock-in.

Module Ecosystem
Real JavaScript plugins that extend the platform structure, backend logic, and frontend UI. Not templates.

Multi-Interface
GUI for security teams, CLI for CI/CD pipelines, MCP protocol for AI agents. Same graph, same API.

Enterprise Deployment
SaaS with per-customer isolation or air-gapped on-premise. Zero-trust validation at every hop.
Not a table problem
Traditional tools treat components in isolation. Graphs reveal what connects them — and what an attacker can reach.
What you can ask a spreadsheet
- List all high-severity vulnerabilities
- Which components are internet-facing?
- How many controls are assigned?
- Sort risks by CVSS score
What you can ask a graph
- Show every path from the internet to PII with fewer than 2 controls
- If this API is compromised, what's the blast radius?
- Which single control protects the most attack paths?
- Where are the chokepoints an attacker must traverse?
Get started in minutes
Model
Drag-and-drop components, connect data flows, configure attributes.
Configure
Assign reusable security controls. Check auto-generated exposures.
Analyze
Run context-aware analysis across the full architecture graph.
Track
Create issues, sync to external trackers, track remediation.
Ready to see the graph?
See how graph-native threat modeling transforms your security posture.